

The FleetAdvance console is a fuel transaction scoreboard with many useful features. The console uses color-coded pins to show you where your drivers’ fueled and to score the value of their transaction:
- A green pin marks a good transaction.
- A yellow pin is average.
- A red pin shows a fuel stop that costs money you didn’t need to spend.
The console also includes cluster and multiple transaction pins. These pins make it easier to view multiple pins and driver performance.
The FleetAdvance console also shows your total fuel spend and fuel savings for the current day.
The basic navigation features resemble many popular map sites on the internet. You can use those features to zoom, scroll, or change the map details (e.g., the standard Map view or Satellite).
Use these links to hop to a specific section:
Filtering Transactions | FleetAdvance Map | Fuel Savings and Spend | FleetAdvance Scorecards | Map Controls | Connection Time | FleetAdvance Ticker
The search feature doubles as a drop-down menu and search tool for finding customer IDs by ID numbers or names. To search multiple IDs, select any number of IDs from the drop-down menu or type them in the search field.
Filtering by transaction score
The filter feature limits the transactions displayed on the map by transaction score (green, yellow, red, or all). Filtering by score will display only pins matching the selected score color.
Tip: You can remove a filter by selecting the red X button that displays next to the filter.


Filtering by driver name
Filtering by driver name will display only pins for the selected driver. Multiple drivers can be selected.
Tip: After you filter by driver, you can filter by score to display only one pin color for that individual. This will give a better view of an individual driver’s performance.

The console map is built on Google maps technology. Each time a driver under the selected customer ID(s) completes a fuel transaction, a pin will populate on the map scoring the transaction in real-time.

Cluster Pins
Pins within a transaction-heavy geographic region are consolidated into a single pin called a cluster pin. Select a cluster pin to drill down to the individual pins for that region. When drilling down, it is possible to see additional cluster pins.
Multiple Transaction Pins
A unique pin designates locations with multiple transactions.
Selecting this pin opens the detail window, starting with the most recent transaction. The window lets you page through each transaction for that location.


Transaction Score Pins
Locations with a single transaction are designated by a pin that includes the transaction score. This lets you review driver performance without having to open each pin.
Transaction Scores
The FleetAdvance score is a measure of how a transaction compares to your other fueling options in the same area, based on your net price paid and considering your company discounts. In other words, it’s the price paid versus the price available.
When you select one of the pins on the map, you will see detailed information on the transaction and the location where it took place.


The Amount Off Low is a key factor in the score. It is the difference between the price your driver paid and the lowest available price in that area. For example, in the image to the right, the driver could have made a 12 cents per gallon cheaper purchase at a nearby location.
Locating the Best Price Alternatives
You can view up to five better price alternatives within the same highway segment whenever you select a red or yellow transaction.
Green markers at the bottom of the page designate each alternative, containing the location name and price at the time of your transaction. Hover your cursor over the green marker to display a gas icon designating the alternative. Select the green marker to keep the icon from disappearing, then select the icon to view more information on the alternative. Or select Show All to display all alternatives. If the highway segment is too large, use the zoom-out feature to see any missing alternatives.


The Comdata Fuel Savings calculation is a total of how much money you saved overall under the selected customer ID(s) for the current day. The Total Fuel Spend field is the total fuel expenditure under the selected customer ID(s)for the current day. Every midnight (Central Standard Time), these two amounts, as well as the data on the map, reset to zero.
This part of the left panel displays real-time transaction data ranked by highest savings to lowest savings. This section can be opened and closed using the arrow icon. Use the drop-down menu to select your desired scorecard.
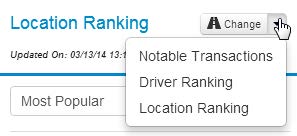
Notable Transactions
This scorecard presents all transactions under the selected customer ID(s) for the current day. You can sort the data view by Newest, Oldest, Highest Score, or Lowest Score. The first column to the right of the driver’s name shows the driver’s score. The second column shows the amount the driver either saved or lost the company on that transaction.
Driver Ranking
Driver Ranking presents fuel transactions by driver name. The data provides the drivers’ score for how they performed in the selected sort type. You can sort the data view by Lowest Savings, Highest Savings, HighestAverage Score, or Lowest Average Score.


Location Ranking
Location Ranking allows you to identify where your drivers are fueling. You can sort the data view by Most Popular, Least Popular, Highest Savings, or Lowest Savings.

1. Use this control to pan up, down, left, or right.
2. Click on the person icon with your mouse and drag it over an area to zoom close enough to see the physical location.
3. Use this control to zoom in or out.
Note: Use the Map/Satellite icon in the upper right corner of the console to switch between a map view and a satellite view.

The data on the console refreshes every 30 seconds, as will the connection time. In the upper left corner of the console, you can double-click the text that reads Connected to view your connection status.


The FleetAdvance Ticker is a retail average price monitor. The ticker displays the average regular and diesel fuel prices for each Petroleum Administration for Defense District (PADD) for the previous day. The ticker also displays the price movement up or down from the day before, indicated by a red arrow. For example, if the current day is Wednesday, the ticker will show PADD pricing from Tuesday as well as the up and down fluctuation from Monday.
The ticker also displays your Comdata fuel savings for the current day, the month-to-date (MTD), and the year-to-date (YTD). This will help you track your fuel saving goals.